Unlock Peak Performance with the New Vantage Analytics Dashboard
Slavena Hristova
July 31, 2026
Making data-driven decisions is crucial for optimizing any business process. When it comes to intelligent document processing (IDP), having clear visibility into your operations is the key to achieving higher efficiency and a greater return on investment. That's why we're excited to introduce the new Analytics Dashboard in ABBYY Vantage 3.0—a powerful tool designed to give you actionable insights into your document processing workflows.
This dashboard isn't just about presenting data; it's about providing a clear path to improvement. You can now monitor performance, measure accuracy, and identify opportunities for optimization with ease. Let's explore how you can use the Analytics Dashboard to enhance your day-to-day operations and maximize the value of your automation efforts.
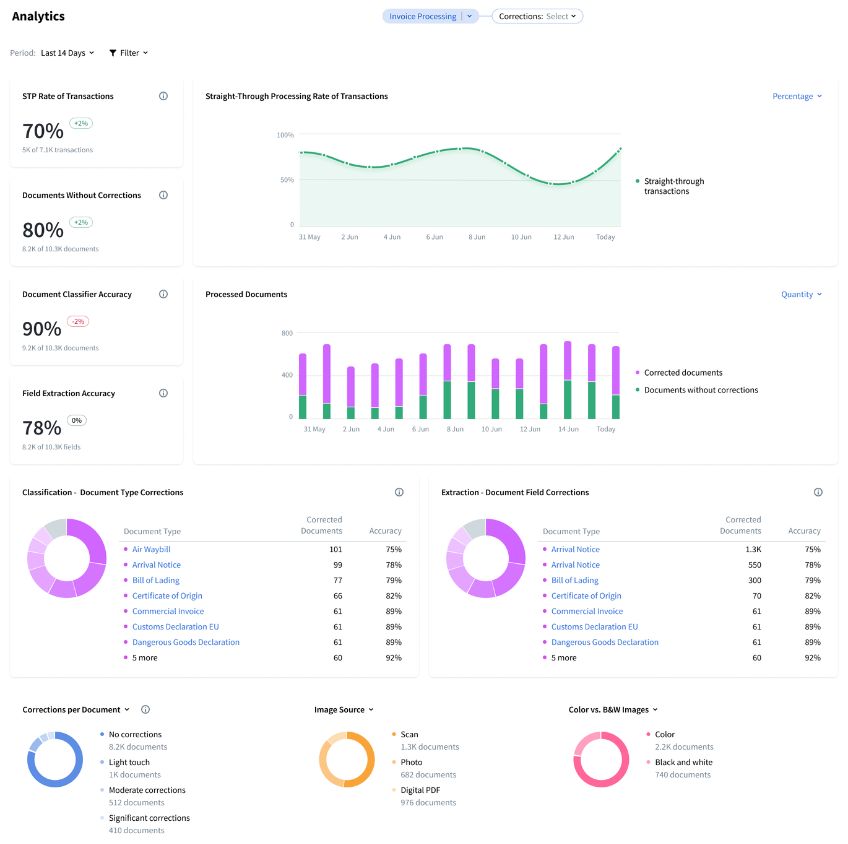
The Analytics Dashboard provides a comprehensive overview of your system's performance, helping you understand how effectively your documents are being processed. It offers visual insights into quality, efficiency, and accuracy over any time period you specify.
Think of it as the control center for your IDP initiatives. It allows your teams to ensure the system is reliable, efficient, and operating at peak performance, while highlighting exactly when and where improvements might be needed.
Key functions at a glance:
Performance monitoring: Track your automation success rate and see how many documents are processed over time.
Accuracy metrics: Measure how well the system identifies document types and extracts data.
Error analysis: Pinpoint where and why manual corrections are needed.
Operational insights: Gain a high-level understanding of document processing health and identify areas for optimization.
How to leverage the Analytics Dashboard for daily wins
The real power of the Analytics Dashboard lies in its practical application. Here's how you can use its features to drive tangible improvements in your document processing workflows.
1. Monitor and boost straight-through processing
Straight-through processing (STP) is a core metric for automation success. It measures the percentage of transactions that are completed without any human intervention. A higher STP rate means lower operational costs and faster processing times.
The dashboard prominently displays your STP rate of transactions. Let's say you're processing thousands of invoices each day. By monitoring this metric, you can immediately see what percentage of those invoices flow through the system without involving a human in the loop (HITL). If you notice your STP rate is lower than desired, it's a clear signal to investigate further.
Practical example: You check the dashboard and see that your invoice processing STP rate has dropped from 85% to 70% over the past week. This prompts you to look at the error analysis section, where you discover that a new invoice format from a major supplier is causing frequent validation errors. You can then quickly retrain the model for that specific format, resolving the issue and restoring your high STP rate.
2. Analyze and improve accuracy metrics
Accuracy is non-negotiable in document processing. The Analytics Dashboard provides granular metrics to help you ensure your data is reliable.
Document classifier accuracy: This shows how well Vantage identifies the correct document type. If you're processing a mix of purchase orders, contracts, and shipping notices, you need to know they are being routed to the correct workflow. A low score here might indicate that some document layouts are too similar and require more specific training data.
Field extraction accuracy: This metric tracks how accurately data is extracted from individual fields. The dashboard also shows the percentage of documents without corrections, giving you a quick measure of overall extraction quality.
Practical example: While reviewing the dashboard, you notice that the field extraction accuracy for your "Purchase Order" skill is consistently high, except for the "Line Items" field. This tells you exactly where to focus your efforts. Instead of a broad, time-consuming review, you can go directly to the model and fine-tune the table extraction logic, leading to a targeted and efficient improvement.
3. Use error analysis to pinpoint optimization opportunities
When things go wrong, you need to know why. The dashboard's error analysis capabilities provide the clues you need to solve problems proactively. You can see visual breakdowns of correction patterns, helping you understand which fields or document types require the most manual effort.
The dashboard also breaks down performance by factors like image source, color profile, and DPI levels. This can help you identify if issues are originating from a specific scanner or source system.
Practical example: Your team reports an increase in manual corrections for tax forms. You consult the Analytics Dashboard and filter for that specific document type. The error analysis section reveals that most corrections are happening on documents with a low DPI. You realize these documents are coming from a mobile capture app. With this insight, you can implement a quality check at the point of capture or adjust the Vantage skill's image pre-processing settings to better handle lower-resolution images.
4. Gain actionable operational insights
The Analytics Dashboard is built for stakeholders at every level. Whether you're an automation lead, a business analyst, or an IT manager, the dashboard provides a clear, shared view of your document processing performace. It helps answer critical questions:
Is the system performing as expected?
Are we meeting our accuracy and efficiency targets?
Where should we focus our resources for the biggest impact?
If STP rates are high and correction rates are low, you have clear evidence that your automation initiative is succeeding. If the opposite is true, you have the data needed to justify investing more time in model training or process refinement.
Start optimizing your workflows today
The new Analytics Dashboard in ABBYY Vantage 3.0 transforms document processing from a black box into a transparent, measurable, and continuously improving operation. By providing clear insights into performance, accuracy, and errors, it empowers you to make smarter, data-driven decisions that reduce costs, accelerate turnaround times, and unlock the full potential of your automation efforts.
Ready to gain deeper insights into your end-to-end process performance? Dive into the Analytics Dashboard and start turning data into action.
To stay current with the "Feature Spotlight" series: Subscribe to the ABBYY blog for the latest feature releases across the Document AI platform.
What is the Analytics Dashboard in the ABBYY Document AI platform?
The Analytics Dashboard is a built-in performance monitoring tool within the ABBYY Document AI platform that gives teams real-time visibility into their document processing workflows. It tracks key metrics including straight-through processing (STP) rates, document classifier accuracy, field extraction accuracy, and error patterns, helping organizations identify where automation is working and where it needs improvement.
What is straight-through processing (STP) and why does it matter?
Straight-through processing (STP) measures the percentage of document transactions completed without any human intervention. A high STP rate means your automation is working efficiently, reducing manual effort and processing costs. The Analytics Dashboard displays your STP rate in real time, so teams can spot drops early and act before they affect operations.
How does the Analytics Dashboard help improve document extraction accuracy?
The dashboard provides granular accuracy metrics at the field and document level, including the percentage of documents processed without any manual corrections. By identifying which fields or document types generate the most errors, teams can target model retraining efforts precisely, rather than performing broad, time-consuming reviews.
Can the Analytics Dashboard identify the root cause of manual corrections?
Yes. The error analysis section breaks down correction patterns by document type, field, image source, color profile, and DPI level. This lets teams trace quality issues back to a specific scanner, capture method, or document variant, and resolve problems at the source rather than downstream in the workflow.
Who can benefit from the Analytics Dashboard?
The Analytics Dashboard is designed for a range of roles, including automation leads, business analysts, IT managers, and compliance teams. It provides a shared, clear view of system health so every stakeholder can track performance against targets, justify optimization investments, and demonstrate the business value of their document automation program.
Slavena Hristova
Director of Product Marketing, Document AI at ABBYY
Slavena Hristova is a seasoned product marketing leader specializing in AI-powered intelligent document processing, OCR, and business process automation. As Director of Product Marketing at ABBYY, she drives the global strategy for the Document AI product line, shaping its market positioning, go-to-market execution, and customer adoption.
With deep expertise in product marketing and management, Slavena bridges the gap between technology and business needs, enabling organizations to harness AI-driven automation for smarter document workflows. Passionate about innovation and the evolving role of AI in enterprise automation, she brings a strategic and results-driven approach to transforming how businesses process and extract value from their data.